
Solid business intelligence is key. Avoid failing in your BI efforts with our handy guide in choosing the right Business Intelligence partner.
What is business intelligence?
Enterprises have a wealth of data at their disposal, but data alone will not generate insights. Business intelligence (BI) Tools are the go-to resource to help companies derive the true potential of their data and make smarter, data-driven decisions.
82% of enterprises are now prioritizing analytics and BI as part of their budgets. The term business intelligence refers to a range of tools that provide quick, easy-to-digest insights about an organization’s current state, based on the data available. While reporting is a central feature of BI, dashboards are one of the classic BI tools.
BI Dashboard automatically pulls together available data into charts and graphs to give a clear picture on the immediate state of the company. In other words, Business intelligence is descriptive, helping enterprises with what’s happening now and what happened in the past to arrive at smarter, data-driven decisions.

Popular BI tools – choosing the right tool for your business
| BI Tool | Good | Bad | Final Thoughts |
|---|---|---|---|
| Microsoft | Familiar, easy-to-use interface like Excel with the ability to create and import simple visuals. | Interface is not always user friendly, challenging for inexperienced users to learn at first. | Cloud-based BI software that is simple to use, correlates disparate data and gives full visibility of business performance. |
| DOMO | Ability to connect data with several connectors, ability to access information and report from single platform, customized solutions. | Expensive for a small business, difficulty in extracting data, on-premise deployment is not offered. | Empowers all users to make better business decisions. |
| BOARD | Combines features of BI and corporate performance management in one platform, job-centric solutions available. | While BOARD does target small businesses, the software could be too robust for an exceedingly small business/team. | BOARD combines the features of BI and corporate performance management (CPM) into an all-in-one, programming-free solution. |
| SAP | Minimal or no involvement from IT, BI analysis done from multiple data sources and in different formats, accessible via any platform. | Confusing licensing process, frequent support fee hikes, tend to be complex for non-tech users. | Broader BI solution with self-service functionality. |
| Tableu | Robust drill-down and visualization tools make data approachable for all types of users. | Customers have mentioned a steep learning curve for executives and the system tends to be slow at times when dealing with large datasets. | Tableau offers intuitive business intelligence tools to enhance data discovery and understanding. |
| Yellowfin | Provides automated analysis to the user based on data patterns and outliers, Yellowfin Stories that combines data reports into one narrative, five components that can be used individually or all together. | Does not include financial forecasting or profit analysis. | Yellowfin Analytics Suite offers automated analysis, storytelling, and collaboration. |
| Exago | 100% web-based with no Plug-ins or downloads required for users or administrators, a balanced combination of tabular reports and interactive dashboards, rich, open APIs provide tight integration with host application. | Chart/visualization library could be expanded, global search is not yet available. | Flexible, white-labelled, easy-to-use embedded BI solution that allows software companies to give their clients control over their own data and reporting. |
| IBM | AI (Artificial Intelligence) Assistant that learns users’ data and suggests new data joins and visualizations; drag-and-drop capabilities to create new dashboards and reports; data integration from two to many sources | Steep learning curve as software can be robust. | IBM Cognos Analytics offers users access to a wide range of business analytics functionality to help them make well-informed decisions faster. |
| Dundas | Combination of BI and analytics in one platform, accessible anywhere at any time, strong focus on self-service. | Inability to export multiple PowerPoint slides at once; 3-D charts and city-level maps are not included as standard features; however, they can be imported by public API. | Scalable embedded BI platform that enables any user to run data and make faster business decisions. |
| Looker | SQL knowledge is not required, LookML proprietary data modeling language, implementation done in hours rather than days or weeks. | It does not support OLAP functionality, learning curve for unaccustomed users. | Looker's web-based platform allows users to explore data in a timely manner to help them make better business decisions. |
Types of BI tools
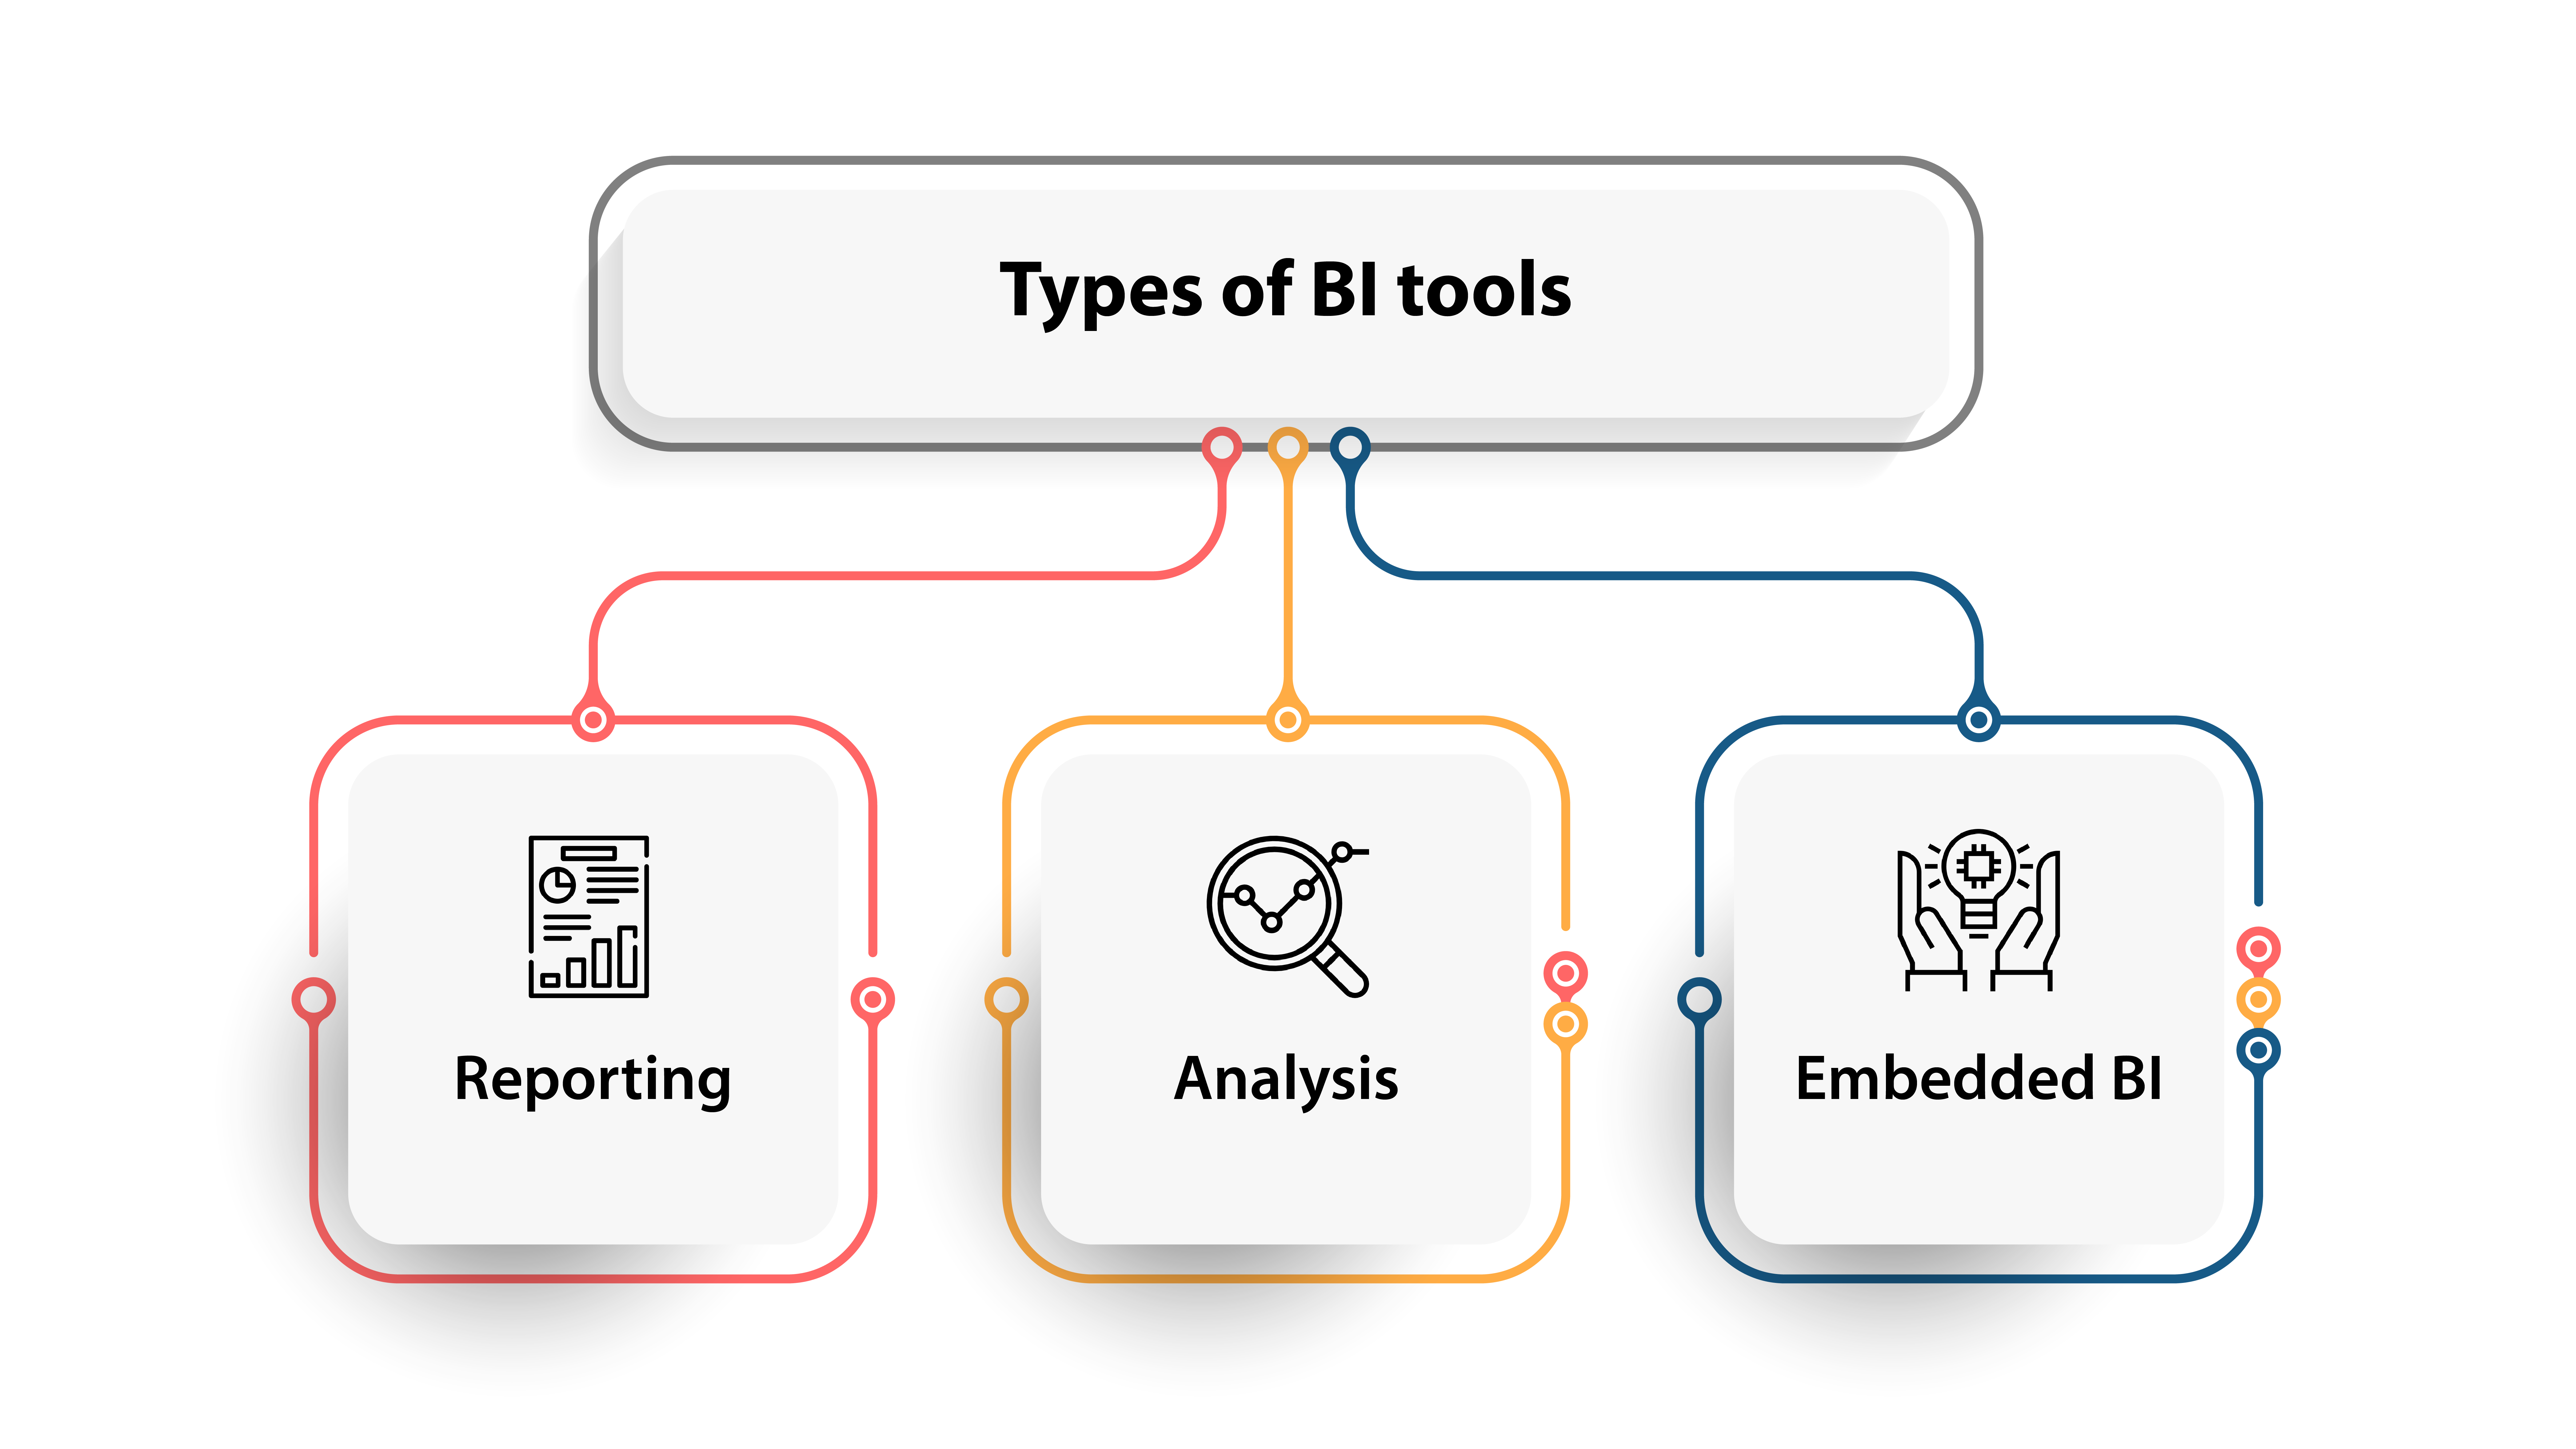
There are typically three main types of BI tools. Below is a guide to the different types available today.
- Reporting – Reporting helps users visualize their data in different formats, such as graphs or charts. They have evolved from static (non-manipulated) reports to interactive reports that let users drill down for more details. Some reporting features include ad-hoc reporting, scheduled reporting, and exporting or sharing reports in different file formats (PDF, Excel, etc.).
- Analysis – Analysis is the main focus of business intelligence. The three types of analysis are spreadsheet analysis, ad-hoc query and visualization tools. Another type is predictive analytics that uses data mining and machine learning to predict future trends within the data. Predictive analytics isn’t just a feature found in BI software; there are dedicated predictive analytics solutions as well.
- Embedded BI – Embedded business intelligence (also known as embedded analytics) is an integration of business intelligence tools into a company’s existing applications. Examples include ERP, CRM, accounting or marketing systems. There are several vendors (e.g., Izenda, Microsoft, Exago BI, Zoomdata) that focus exclusively on embedded software.
Benefits of using business intelligence tools
- Increased collaboration – BI tools can greatly improve collaboration and break down silos among teams, as everyone has access to the same information. The reports and dashboards are interactive and easily shareable. Anyone can leave comments directly within the dashboard or report. Reports can also be shared securely to external users, such as clients or vendors.
- Ability to combine data from multiple sources – Companies use many different systems to run their business, and each system can store large amounts of data. BI software connects data from multiple internal as well as external sources so users can perform analytics in one platform.
- Improved productivity for IT staff and data analysts – Many BI tools offer self-service functionality so end users can easily access features without having to rely on a data analyst or IT department. Also, some features of BI software are automated, such as data cleaning, which allows data analysts to focus on more important jobs.
- Identify new business opportunities – Business intelligence helps enterprises improve their business, such as making new sales or revenue, improving customer service or creating new job roles. With the help of BI software’s forecasting features, such as predictive analytics, users can easily spot trends in their data. BI tools also guide companies eliminate any processes that no longer work or hinder productivity.
- Access to real-time data for on-the-fly decision making – To get a competitive advantage in the market, businesses need to quickly adapt to the changing conditions. Therefore, critical decisions sometimes have to be made quickly. Business intelligence software includes automated features, enabling users get the answers they need right away.

A quick checklist before choosing a BI tool

With the recent growth in the business technology, there are more vendors than ever to help your company with power BI service. BI solutions have increasingly become significant to all progressive enterprises, but choosing the best BI solution needs a good amount of research. That’s why you must do your homework before choosing a solution.
- Know what your company needs – It is key to identify your main objectives for using the BI software (also known as use cases). Examples include, where does your company need to improve? Revenue? Sales? Employee performance? New business opportunities? These objectives will help in establishing your use cases.
- Create a shortlisting funnel – Once you have identified your objectives for using the BI tool, the next step is to create a shortlist of vendors that best fit your business needs. Start with listing out the must-have features, as well as the nice – to – have – but – not -urgently-needed ones, to help determine the type of tool you are looking for.
- Contacting vendors – Explain what your business objectives are and what features you need in a solution. You will also want to request a demo of the software with real-data scenarios, if possible. Another way to test a software is to opt for a free trial, if there is one. Most vendors offer a 14 or 30-day free trial. Lastly, you will want to compare different prices you received.
BI software market trends to look out for

Like other software markets, the BI market experiences changes in trends. Below are a few key trends to look out for:
- AI will be a key factor in BI software – Most vendors have started to offer AI and machine learning features to help enterprises accelerate their BI transition journey.
- Data governance continues to be a priority – Data governance continues to be a high priority for enterprises. Since data governance aims to protect the security of the data, and help users put processes in place that ensure data is of high quality, it continues to be a non-negotiable issue.
- High demand for embedded analytics – Embedded analytics is not new, but the demand is increasing as more companies want convenient access to analytics within their software applications. Data Bridge Market Research has predicted that the growth for global embedded analytics solutions will rise up-to 14% by 2025.
The future of business intelligence
In the years to come, Gartner sees a third wave of disruption called augmented analytics, where machine learning is integrated into the BI software and is believed to guide users into the data.
To put it simply, someone can look at last year’s sales report, but with BI and machine learning they will get predictions about next year’s sales as well. The system will be designed to make higher-value recommendations. It aids in making the decision-maker efficient, more powerful and more accurate.
Although BI reporting tools will remain valuable, but organizations can’t compete if they’re not moving beyond BI and adopting advanced analytics as well.
While reporting is essential, it alone is not enough. If enterprises are only doing reporting, they are behind already. Unless reporting is smart and agile, businesses have a lot of catching up to do!